Exploring open data for fun and profit with LLMs
The web has always been a playground and we’ve been handed new tools to play with in the form of LLMs. So in the evenings I had time to tinker I’ve explored open data sets and combed through questions that people asked me…
With the help of Claude & Cursor I could discover different harnesses and setups that would allow me to make better use of public data. As the LLMs collapse the barrier of entry it is up to us to discover the most interesting bits & bobs!
Working with the UWV through the Pilot Information Autonomie I got a couple of questions to explore the WOO (Wet Open Overheid) documents. Starting of to summarize a big one to exploring data that could be extracted. I’ve let Opus, Sonnet, smaller models, even some local ones crawl trough the PDFs to extract valuable data.
I don’t build software that quickly, but focusing on guidance and harnesses resulted in LLMs building compact software pipelines (OCR & NER for example!). Along the way I figured out that in this case there isn’t a naming standard for the files I was investigating, quite possibly for the reason no standardized process exists. The LLMs happily chew their way through the files!
Sidenote: when talking about AI, I noticed that most people focus on productivity (or time not spend). How about sharing prompts, context and composable software, that way we all benefit! Talk about productivity is cheap, show it to the people (and llms!) there is no reason to gatekeep here, it’s public data anyway.
In line with this mentality, here are the steps I took in collaboration with the LLM:
- Gather all URLs for each WOO request.
- Downloading all decision files made by UWV for the WOO. (be kind, not all at once!) (gist)
- Clean up the files extract dates/timestamps from each file
- Create a html file (a file is the app!) to view the data.
And here’s the result! Please note this hasn’t been checked thoroughly and it might be wrong at places, I did not write any code, LLMs did.
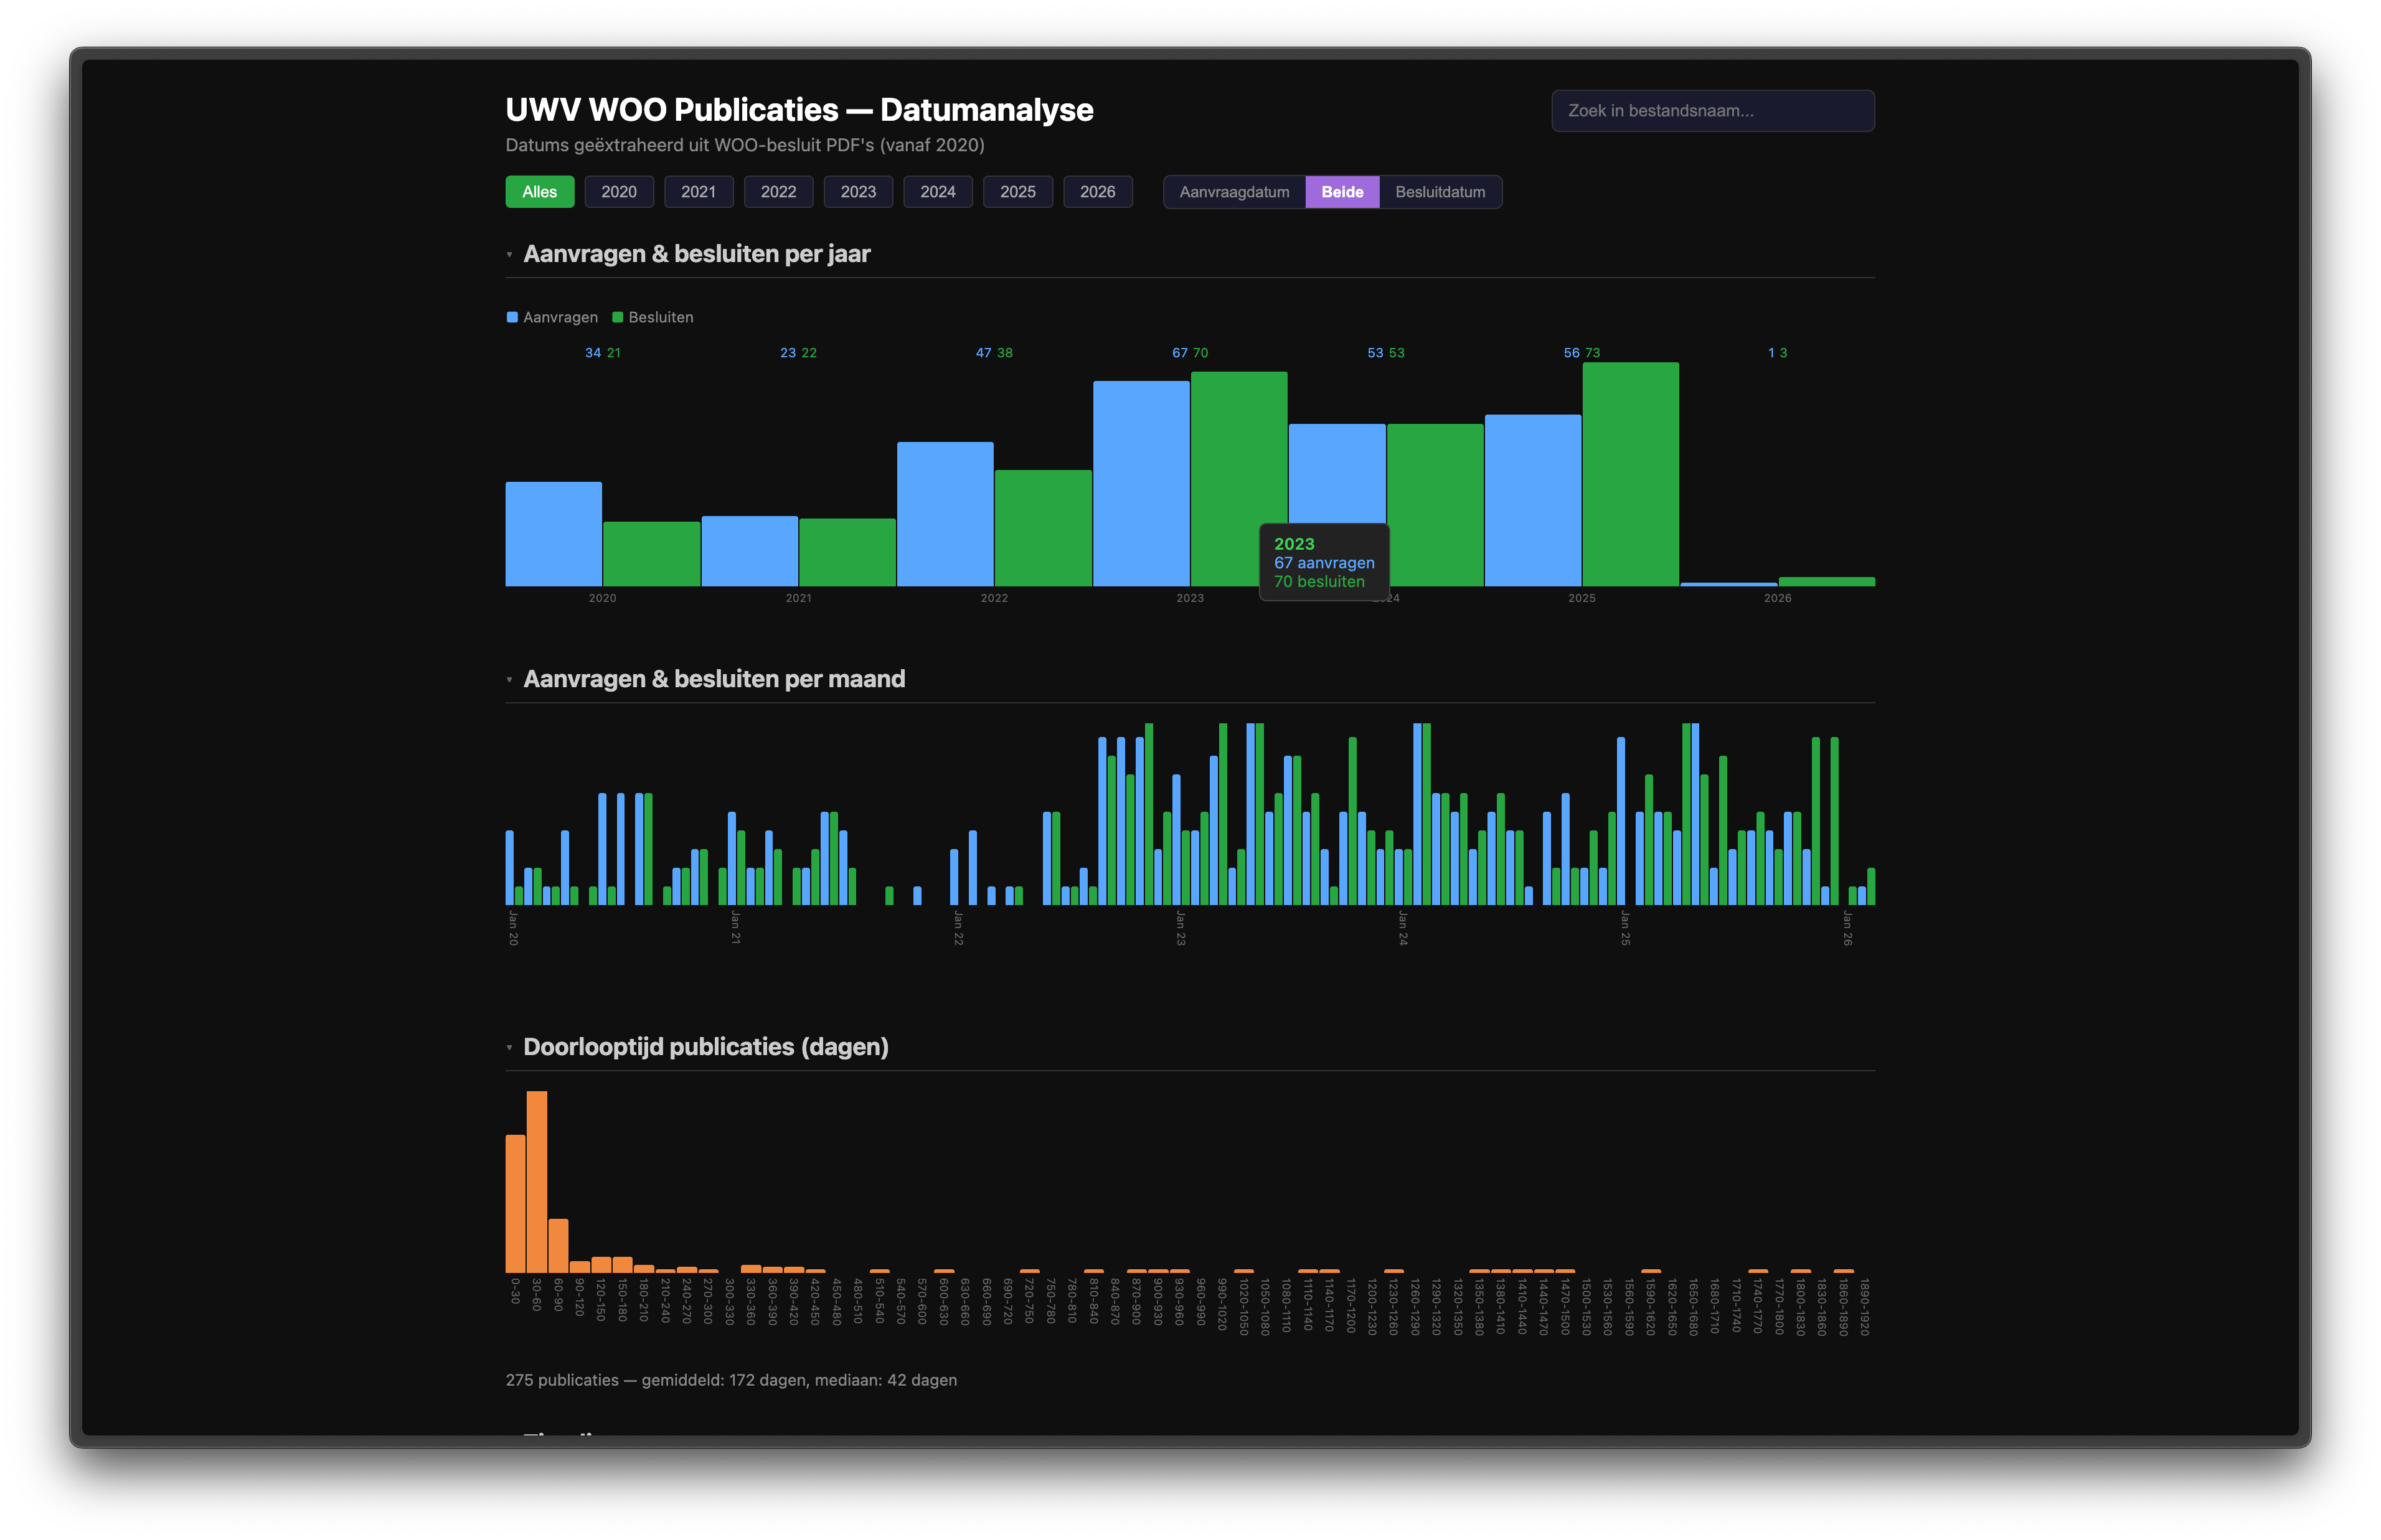
A filterable, clickable dashboard instead of dry list of PDFs that aren’t user friendly. If this doesn’t fit your needs, no worries!
If you want topic frequency analysis? Full NER pipeline or other visualisations? Gather the above gists and the HTML and ask a LLM!
I’ll leave it as an exercise for the reader to figure out the implications if there are more people like me who are just curious!
If you are still curious on how long it took? I’m estimating about 2 hours at most (including waiting for the downloads!🤭) Why are you paying expensive consultants!🤓