Experimenting with company activity dashboards
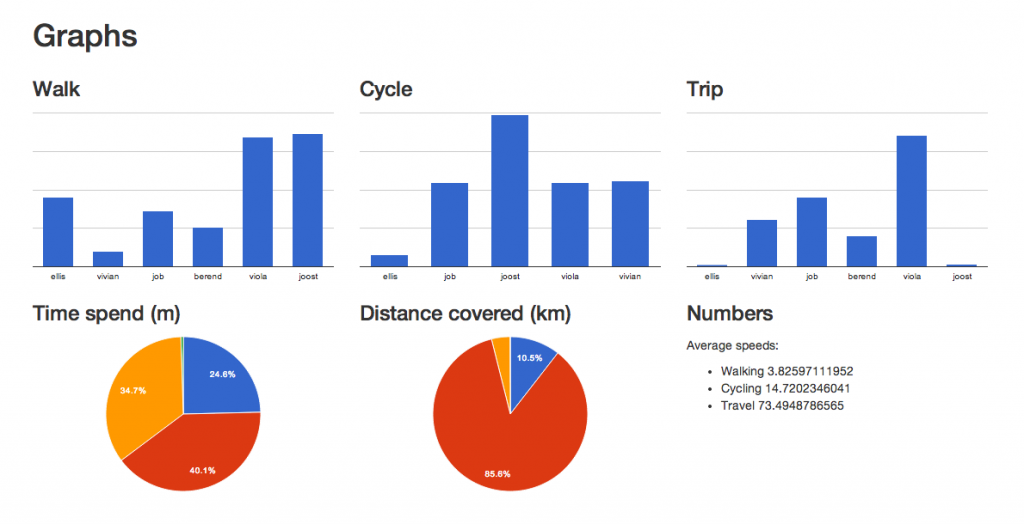
As an experiment, I’m collecting data from the Moves app from multiple persons within a organisation. The goal is to find out what’s possible with the amount of data the persons generate each day. Currently, the collection of data is ongoing and the next step would be the visualization of the data. Here are some simple graphs you can make with the data:

Further steps could be exploring what a group wants from visualisations like this. It’s the most benificial if the change of behavior sustains after the initial period of interest. This could be investigated by using different ways for reminders, notifications or possibly reward systems.
I’ve also discovered that data and visualisation like this raises ethical questions. This is exactly why doing a small-scale pilot helps me develop this as a product that is accepted more readily into the company culture without having a negative influence. I’m curious where this is going!