Data-visualisation for the Hogeschool van Amsterdam
Together with Heinze I’ve guided and taught several students from the Hogeschool van Amsterdam about data and data-visualisation. In 3 days packed with GPS-trackers, stories, examples and code we’ve made some interesting visualisations.
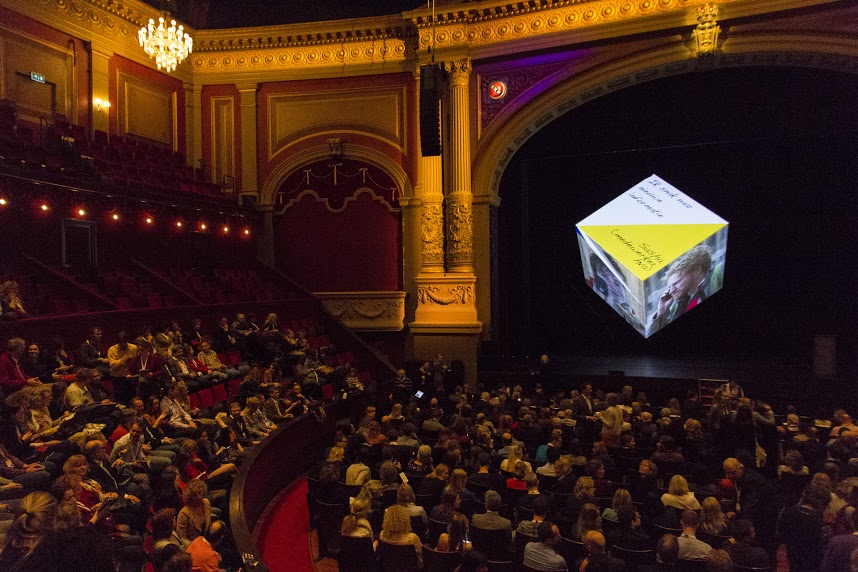
Some were shown in Carre during the education conference organised by the Hogeschool van Amsterdam. Thanks Captain Video for the awesome setup with a cube:
Ofcourse I’ve also made my own data-visualisation. The data consists of minute-by-minute data available trough the Fitbit data API. This data is stored in a simple CSV file and visualised with D3, my favorite SVG library for visualisations, the result is a canvas with triangles related to the Hogeschool itself: